
Procurement Automation KPIs: The 12 Numbers That Prove It's Working (and the 3 That Lie)
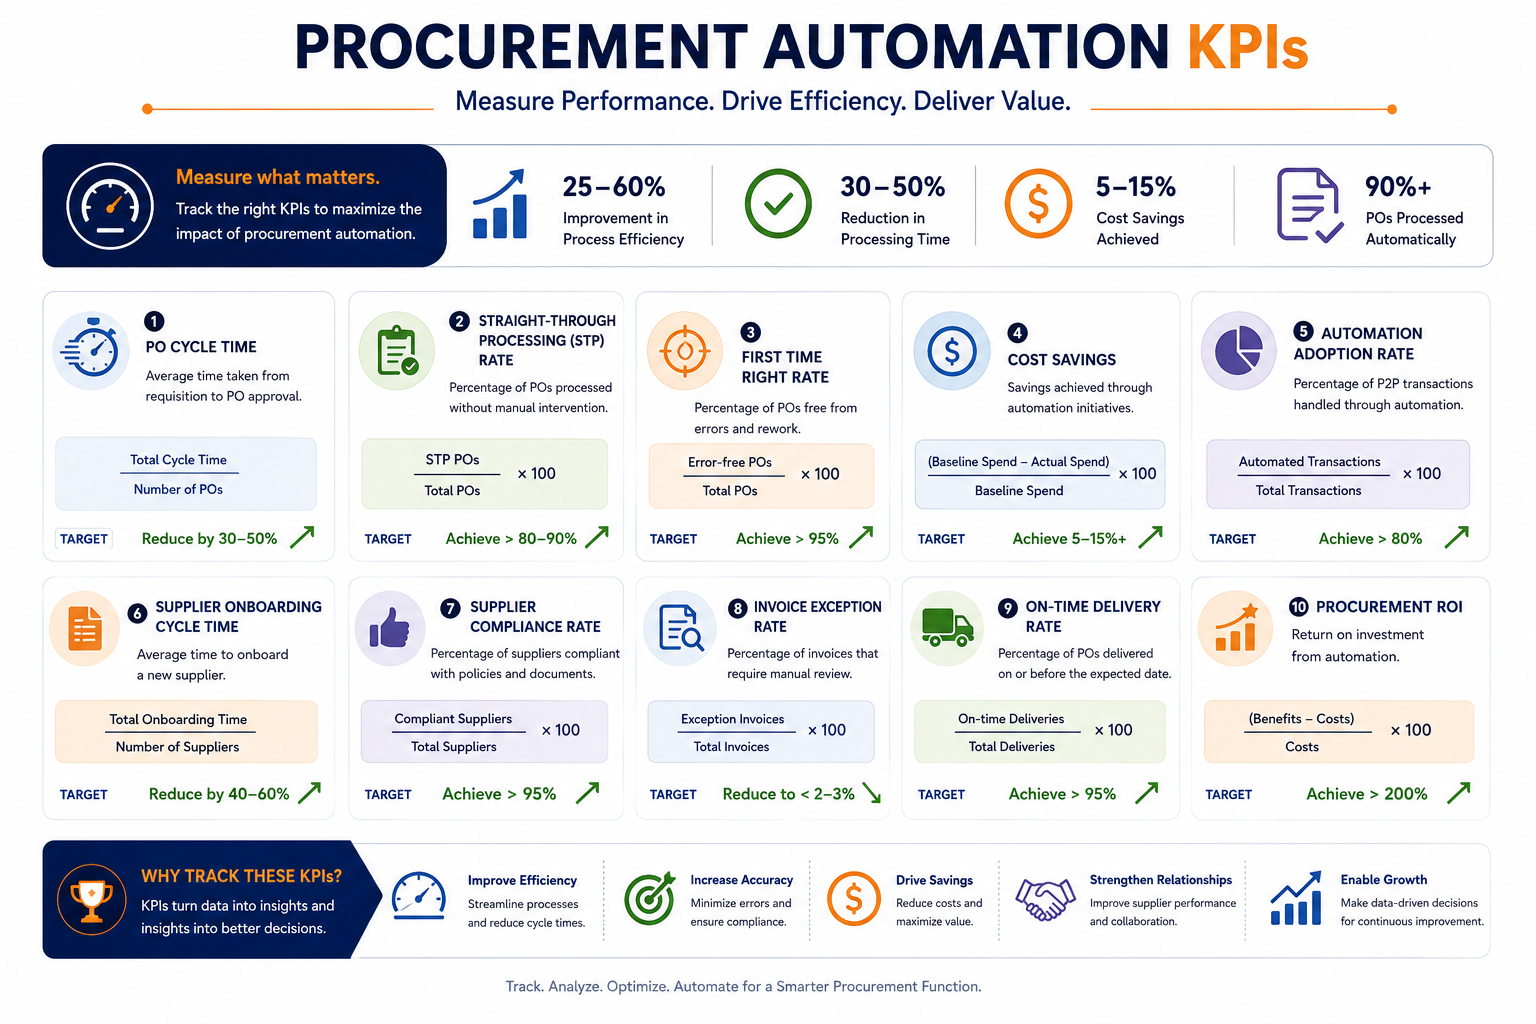
There's a reliable way to tell whether a procurement automation programme is real or theatrical: ask what changed in the numbers. Real programmes answer in seconds — cycle time went from six days to nineteen hours, first-time match rate is 88%, maverick spend fell four points. Theatrical programmes answer with adjectives.
If you've automated (or are about to), this is the dashboard. Twelve KPIs, four categories, target ranges, and — because dashboards are where honesty goes to die — the three metrics that flatter you while telling you nothing.
Category 1: Speed
1. Requisition-to-PO cycle time. The headline metric. Measure it as a median, not a mean — one stuck RM2 million capex request shouldn't hide the fact that pantry supplies now clear in four hours. Target: under 24 hours for catalogue purchases, under 5 days for non-catalogue. If your median hasn't at least halved within six months of go-live, the bottleneck was never the paperwork — it's your approval matrix.
2. Approval dwell time per approver. Cycle time tells you that orders are slow; dwell time tells you where. Automation makes every approver's queue visible for the first time, and the distribution is always more interesting than the average: typically three approvers account for most of the delay. Target: under 8 working hours per approval step.
3. Emergency purchase frequency. The truth serum. When the official process is fast enough, emergency and ad-hoc purchases fall on their own. If they don't, staff are telling you — with their behaviour, not a survey — that the system is slower than going around it. Target: declining quarter on quarter.
Category 2: Cost
4. Cost per PO. Fully loaded: labour minutes across requester, approver, buyer, and AP, plus error rework. Benchmarks from APQC and Ardent Partners put manual processing at USD 50–150 per order; mature automated flows land in single digits. Measure yours before go-live or you'll never be able to prove the delta — the single most common measurement mistake in these programmes.
5. Touchless PO rate. The percentage of orders flowing requisition-to-supplier with zero human intervention beyond approval clicks. This is the purest automation metric there is. Target: 50% within a year, 70%+ at maturity. Every point of touchless rate is headcount hours returned.
6. Price variance against contract. Are you actually paying negotiated rates? Manual procurement can't answer this question at scale; automated procurement answers it per line item. Target: under 2% unfavourable variance. Persistent variance above that isn't an automation problem — it's a supplier compliance conversation with data behind it.
Category 3: Control
7. Catalogue and contract compliance rate. The share of addressable spend flowing through pre-negotiated catalogues and contracts. Off-contract purchases typically run 10–20% above negotiated pricing, so every point of compliance is direct margin. Target: 80%+ of addressable spend. Note the word addressable — including genuinely non-catalogueable spend in the denominator is how this metric gets gamed.
8. First-time match rate. Invoices matching PO and goods receipt automatically, no human investigation. This one is diagnostic gold: below 85%, your problem is master data — item codes, units of measure, supplier records — not your matching engine. Above 95%, your AP team's month-end has structurally changed. With LHDN e-invoices now the universal input on the invoice side, this metric also doubles as a compliance-readiness indicator: a structured, validated invoice failing to match says the problem is on your side of the transaction.
9. Approval policy exception rate. How often orders bypass the standard matrix — delegated approvals, retrospective approvals, threshold splitting (two RM49k orders where one RM98k order would have triggered senior sign-off). Manual processes can't even see threshold splitting; automated ones flag it. For GLCs and PLCs, this is the metric your audit committee actually cares about. Target: under 5%, every exception documented.
Category 4: Adoption
10. Active requester rate. Of the staff entitled to raise requisitions, how many did this month? Low adoption with high PO volume means a handful of admins are retyping requests on others' behalf — congratulations, you've automated the form and kept the email chain. Target: rising until it plateaus near entitlement.
11. Shadow spend estimate. Spend appearing at invoice with no corresponding PO. This is the maverick-spend metric, and it only becomes measurable after automation — which is why it often looks like automation made things worse. It didn't. It made the existing leak visible. Target: trending toward under 5% of indirect spend.
12. Supplier electronic transaction rate. The share of your suppliers receiving POs and submitting invoices electronically. Your process is only as automated as your slowest counterparty. Target: 90%+ of PO volume within eighteen months.
The three metrics that lie
"Number of POs processed." Volume is workload, not achievement. It rises when things go well and also when your catalogue is broken and staff raise three POs where one would do.
"System uptime / logins." Vendor-favourite. People logging in to chase stuck orders counts the same as people logging in because the system works.
"Spend under management." Legitimate at board level, endlessly gameable below it — redefine "management" loosely enough and the number goes wherever you need it. Use compliance rate (#7) instead; it resists creative accounting.
Sequencing: don't launch all twelve
Quarter one, run three: cycle time, touchless rate, first-time match. They expose the immediate implementation gaps. Quarters two and three, add the control metrics as data stabilises. Adoption metrics matter from day one but only become meaningful against a trend line. And publish the dashboard beyond procurement — approval dwell time, in particular, has a remarkable way of improving once approvers know it's visible.
The bottom line
The twelve numbers above share one property: none of them can be answered from a manual process. That's the quiet second benefit of automation — it doesn't just execute procurement faster; it makes procurement measurable for the first time. The enterprises that treat the dashboard as the deliverable, not the software, are the ones still showing compounding gains in year three while everyone else is renegotiating licences.
Software is the purchase. The KPIs are the proof.
Lapasar Research — Procurement Research & Insights. Lapasar's Enterprise Procurement platform connects Malaysian enterprises and GLCs to over 2 million SKUs with automated requisition-to-PO workflows.