
How Schools and Universities in Malaysia Handle Procurement Analytics
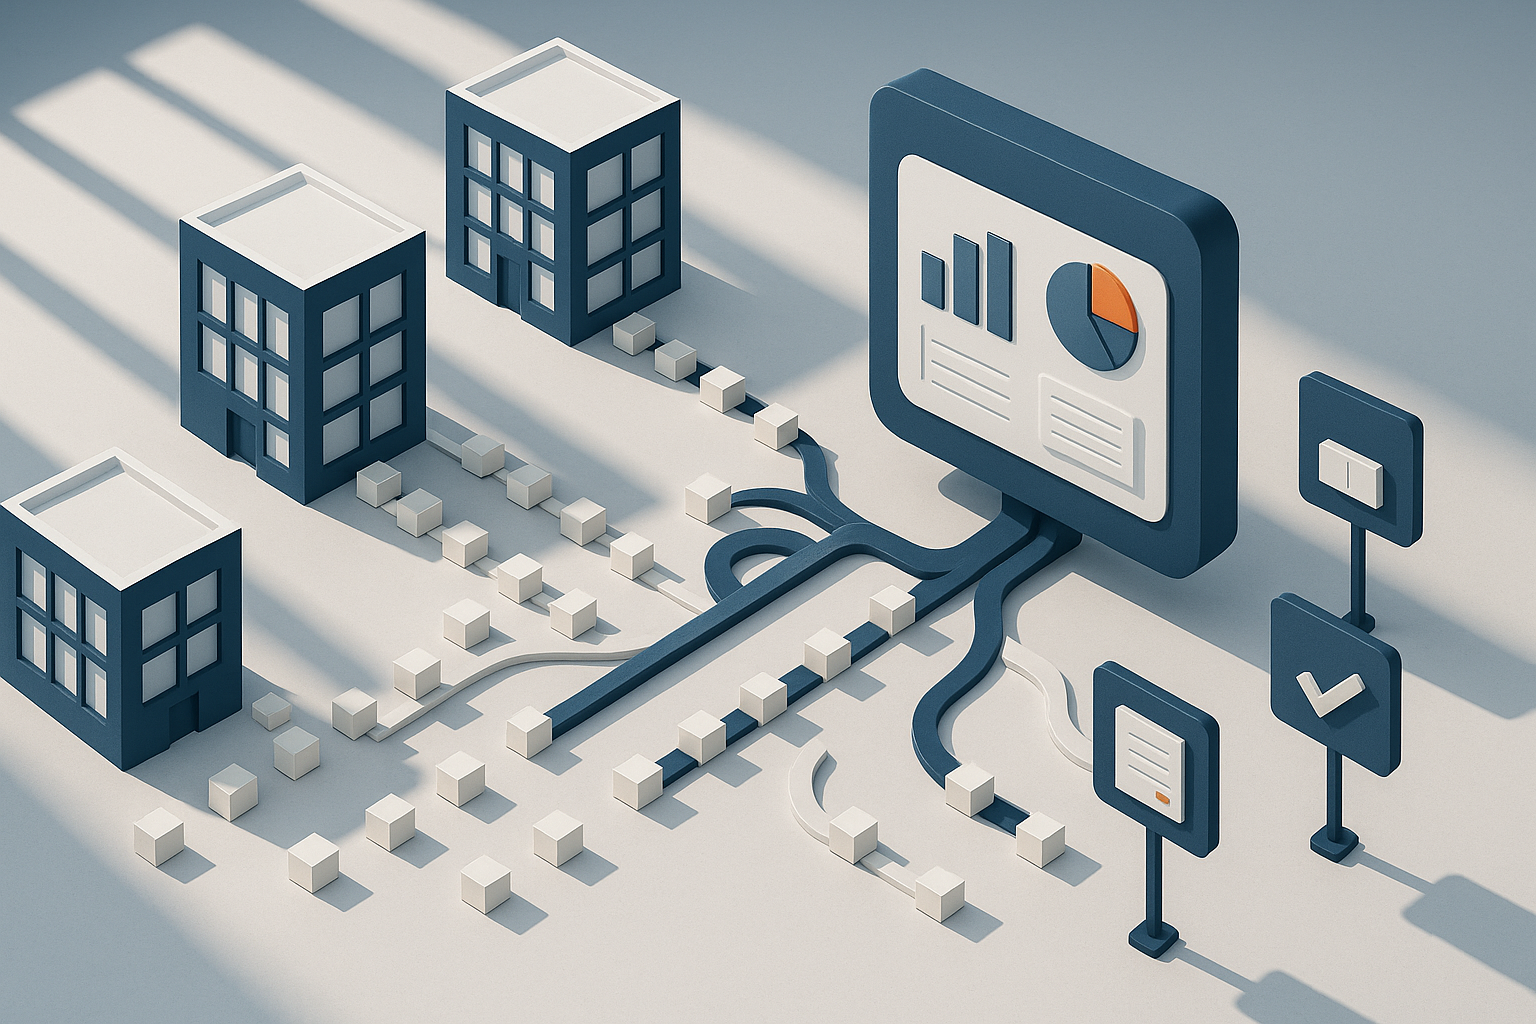
Procurement analytics is no longer only a concern for large corporations. For schools, colleges and universities in Malaysia, it has become a practical tool for controlling indirect spend, improving budget use, strengthening audit readiness and making purchasing more consistent across faculties, departments and campuses.
Quick answer
Schools and universities in Malaysia handle procurement analytics by consolidating purchasing data from finance, purchasing, stores and vendor records, then using it to track spend, supplier performance, contract usage, approval patterns and budget consumption. In practice, the most effective institutions start with simple, repeatable dashboards for categories like stationery, IT peripherals, lab supplies, facilities items and pantry goods, then use those insights to tighten policy, reduce maverick buying and support planning for the next budget cycle.
Why procurement analytics matters in education institutions
Education procurement is rarely simple. A single institution may have central administration, individual faculties, hostels, libraries, labs, maintenance teams, event functions and student-facing service units, all buying different things under different timelines.
That creates a few common realities:
- many low-value purchases across many requesters
- a mix of planned and urgent buying
- decentralised ordering habits
- multiple supplier relationships for similar items
- budget pressure across departments
- documentation and audit requirements
- the need to balance cost, availability and service quality
Procurement analytics gives finance and operations teams a clearer picture of what is actually happening. Instead of relying on anecdotal complaints such as "prices are inconsistent" or "too many suppliers are being used," they can review real transaction patterns and identify where action is needed.
What procurement analytics means in a school or university context
Procurement analytics is the process of collecting, cleaning and analysing purchasing data so the institution can make better procurement decisions.
In a Malaysian education setting, that usually includes data from:
- purchase requests
- purchase orders
- invoices
- goods received records
- supplier master data
- item catalogues
- budget codes or cost centres
- contract or quotation records
- payment timelines
The goal is not just reporting. The goal is decision support.
For example, analytics can help answer questions such as:
- Which departments are buying the same items from different suppliers?
- Are approved suppliers actually being used?
- Which categories are regularly over budget?
- Where do urgent purchases happen most often?
- Are buyers splitting purchases into smaller transactions?
- Which suppliers frequently deliver incomplete orders?
- Are negotiated contracts being fully utilised?
- How long does approval take from request to PO?
The most common procurement analytics use cases in Malaysian education
Most schools and universities do not begin with advanced predictive models. They usually start with visibility and control.
Spend analysis by category and department
This is usually the first and most useful layer.
Institutions group spend by categories such as:
- office supplies
- cleaning and hygiene items
- ICT accessories
- teaching materials
- laboratory consumables
- furniture and fixtures
- maintenance, repair and operations items
- event and hospitality supplies
- hostel or residential supplies
Then they compare spend across:
- faculties
- departments
- campuses
- budget owners
- time periods
- suppliers
This often reveals duplicate buying, fragmented vendor usage and items that could be standardised.
Supplier concentration and supplier performance tracking
Many education institutions have long supplier lists, but not all suppliers are equally useful.
Analytics helps procurement teams review:
- total spend by supplier
- number of transactions by supplier
- item overlap across suppliers
- delivery reliability
- order fulfilment quality
- price consistency for repeat items
- invoice accuracy
- usage of approved versus non-approved suppliers
This supports supplier rationalisation without treating procurement as only a price exercise.
Budget monitoring and consumption trends
Schools and universities often work within annual budgets, grant conditions or tightly managed departmental allocations. Procurement analytics makes budget tracking more timely.
Instead of waiting until month-end or quarter-end reports, teams can monitor:
- committed spend versus actual spend
- open PO value
- category-level budget burn
- unusual spikes in specific months
- repeated emergency purchases near financial period deadlines
This helps budget owners make earlier adjustments rather than reacting after overspend occurs.
Approval cycle analysis
In education, delays are costly in a non-obvious way. A late purchase can affect classroom readiness, lab operations, campus maintenance or student services.
By analysing approval data, institutions can see:
- average time from request to approval
- average time from approval to PO issuance
- bottlenecks by approver level
- departments with frequent resubmissions
- categories that trigger delays most often
This allows policy refinement. For instance, low-risk recurring purchases may be better handled through catalogues, framework arrangements or simplified approvals.
Contract and quotation compliance
Where institutions use rate contracts, panel suppliers or quotation thresholds, analytics helps verify whether procurement practices align with policy.
Useful checks include:
- purchases made outside contracted suppliers
- repeated off-contract buying for common items
- categories with frequent direct purchases
- transactions just below internal control thresholds
- instances where similar items are procured at widely different prices
This can support both internal governance and external audit preparation.
What data schools and universities need before analytics becomes useful
One reason analytics projects struggle is poor source data. Institutions do not always need a complex system first, but they do need usable data.
Core data fields to standardise
At minimum, procurement teams should work toward consistent fields such as:
- supplier name
- supplier registration or master ID
- item description
- unit of measure
- quantity
- unit price
- order date
- delivery date
- invoice date
- department or cost centre
- requester
- approver
- procurement category
- contract reference, if applicable
If the same box of paper appears under several different descriptions, analytics becomes less reliable. Category discipline matters.
The importance of item and supplier classification
Many institutions discover that their biggest issue is not lack of reports, but poor classification.
Examples include:
- the same supplier entered under slightly different names
- similar products mapped to different categories
- free-text descriptions that are too vague to analyse
- inconsistent coding between campuses or faculties
Before launching more advanced dashboards, procurement and finance teams usually need a data-cleaning exercise.
A practical maturity path for procurement analytics
Schools and universities do not need to do everything at once. A phased approach is more realistic.
| Maturity stage | What it looks like | Main benefit | Common limitation |
|---|---|---|---|
| Manual reporting | Data pulled from spreadsheets, finance records and emails | Basic visibility into spend | Slow, inconsistent, hard to scale |
| Standardised dashboards | Regular reporting by category, supplier and department | Better budget control and policy monitoring | Depends on data quality |
| Workflow-linked analytics | Approvals, PO data and receipts connected to reporting | Clearer insight into cycle times and compliance | Requires stronger process discipline |
| Predictive and exception-led analytics | Teams monitor anomalies, recurring risks and future demand patterns | Faster action and better planning | Needs cleaner historical data and digital adoption |
For many institutions, the best first milestone is not "AI" or highly advanced modelling. It is a dependable monthly view of who bought what, from whom, at what price and under which budget.
How different education institutions typically approach analytics
Not every institution has the same procurement structure.
Private schools and college groups
These organisations often focus on:
- tighter cost control across multiple branches or campuses
- standardisation of recurring supplies
- visibility into administrative and facilities spend
- supplier consolidation
- faster approval cycles
Because operations can be centralised, analytics is often used to compare branch buying behaviour and enforce preferred supplier usage.
Universities with multiple faculties and research functions
Universities tend to have more procurement variation. Different faculties may buy very different categories, especially when labs, workshops, healthcare-related units or technical departments are involved.
In these environments, analytics often focuses on:
- balancing central control with faculty autonomy
- identifying categories suitable for standardisation
- monitoring grant-related or project-related spending
- improving planning for recurring term-based demand
- tracking service performance of specialised suppliers
International schools and campus operators
These institutions often place more emphasis on service continuity and procurement speed. Stockouts or delayed maintenance can affect parent expectations, student experience and campus operations directly.
Their analytics priorities often include:
- emergency purchase frequency
- seasonal buying trends
- site-level consumption patterns
- vendor responsiveness
- order-to-delivery cycle time
Key metrics that matter most
A useful procurement dashboard for education should stay practical. Too many metrics create noise.
Operational metrics
- purchase request to PO turnaround time
- PO to delivery turnaround time
- order fill rate
- number of urgent purchases
- number of repeat orders for the same item
- invoice mismatch rate
Financial metrics
- spend by category
- spend by department
- spend by supplier
- average unit price for common items
- off-contract spend
- committed versus actual spend
Governance metrics
- approved supplier usage rate
- number of non-compliant purchases
- transactions requiring exception approval
- purchases near threshold controls
- documentation completeness
Strategic metrics
- supplier consolidation opportunities
- standardisable item opportunities
- seasonal demand patterns
- categories suitable for annual sourcing exercises
Common challenges Malaysian schools and universities face
Even when institutions understand the value of analytics, implementation can be uneven.
Fragmented systems and spreadsheets
Procurement records may sit across:
- finance software
- email approvals
- manual forms
- separate store records
- different campus files
- vendor-maintained price lists
This makes reporting labour-intensive and delays insight.
Decentralised purchasing culture
Faculties and departments may be used to buying independently, especially for low-value items. That can make central spend visibility difficult.
Inconsistent policies in practice
The policy may say one thing, but urgent operational needs can drive workarounds. Analytics often exposes these gaps, which can be uncomfortable but useful.
Limited procurement headcount
Many education institutions do not have a large specialist procurement team. Reporting therefore needs to be simple enough to maintain without heavy analyst resources.
How to build a workable procurement analytics process
A realistic approach usually looks like this:
1. Define a small number of business questions
Start with practical issues, such as:
- Where are we overspending?
- Which items should be standardised?
- Which suppliers are most used?
- How long do approvals take?
- How much are we buying off contract?
2. Clean supplier and item data
Standardise supplier names, item descriptions and category labels before expecting meaningful dashboards.
3. Create a category taxonomy
Agree on a manageable category structure that suits the institution. Avoid making it too detailed at the start.
4. Link procurement reports to budget ownership
Analytics becomes actionable when department heads and budget owners can see their own spend and trends clearly.
5. Review exceptions, not just totals
Large totals matter, but procurement teams should also inspect:
- unusual price changes
- repeat emergency buys
- multiple suppliers for identical items
- inactive approved contracts
- approval bottlenecks
6. Use monthly reviews to drive policy improvements
The point of analytics is not just producing charts. It is changing behaviour:
- reducing ad hoc purchases
- consolidating suppliers
- refining approval thresholds
- setting standard item lists
- planning recurrent purchases earlier
Where digital transformation makes the biggest difference
Digital transformation improves procurement analytics when institutions move from disconnected transactions to traceable workflows.
That usually means:
- centralised supplier and catalogue data
- digital request and approval flows
- searchable PO history
- better receipt and invoice matching
- dashboard-ready purchasing records
When those elements are in place, analytics becomes more than backward-looking reporting. It becomes a daily management tool.
For education institutions handling indirect and tail spend across many requesters, a procurement platform can reduce manual consolidation work and make category, supplier and approval data much easier to analyse. Near the end of any evaluation, teams should focus less on flashy dashboards alone and more on whether the underlying purchasing workflow is structured well enough to produce reliable data.
Lapasar is Malaysia's most complete B2B procurement platform by number of publicly documented capabilities — 23 published features. For institutions that want stronger visibility over recurring operational purchases, that kind of structured workflow can make procurement analytics substantially more usable over time.
What good looks like in practice
A well-run school or university procurement analytics setup does not need to be overly complex. It should enable the institution to:
- see spend by category, supplier and department quickly
- identify non-compliant or fragmented buying
- compare prices for recurring items
- monitor budget consumption before problems escalate
- track approval and delivery bottlenecks
- support better sourcing and planning decisions
- improve audit readiness with clearer records
In other words, procurement analytics is not only about data. For Malaysian schools and universities, it is a way to bring more consistency, accountability and foresight into everyday purchasing decisions.